
Key Insights
The 3D Electromagnetic Simulation Software market is poised for significant expansion, driven by escalating demand across pivotal industries including automotive, aerospace, and telecommunications. This growth is underpinned by the critical need for accurate and efficient design and analysis of electromagnetic components, essential for enhancing performance and optimizing development timelines and costs. Technological advancements in computational power and algorithmic efficiency are facilitating more intricate simulations, accelerating market penetration. The increasing complexity of electronic devices, coupled with the imperative for miniaturization and superior functionality, are primary growth catalysts. The market size is projected to reach $19.2 billion by 2025, with an anticipated Compound Annual Growth Rate (CAGR) of 16.5% from 2025 to 2033. This robust growth trajectory is expected to be particularly pronounced in regions with advanced technological infrastructure and concentrated research and development activities.

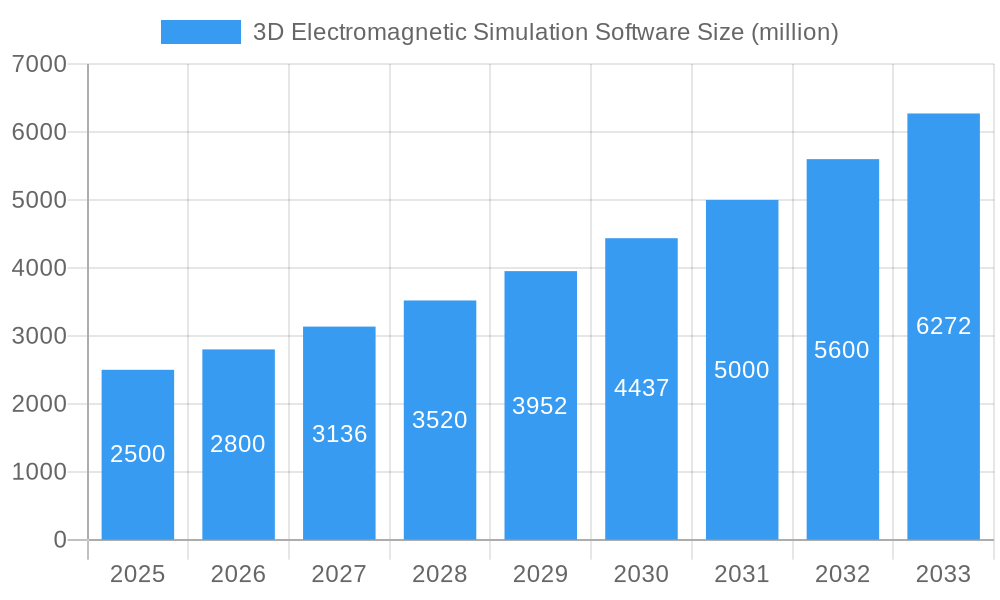
3D Electromagnetic Simulation Software Market Size (In Billion)

Leading industry players, including ANSYS, Dassault Systèmes, and Remcom, offer comprehensive software solutions that define the market. The competitive landscape also features numerous specialized vendors addressing niche applications and offering competitive pricing. This dynamic environment is characterized by continuous innovation, strategic alliances, and mergers and acquisitions. While substantial software investment and the need for specialized expertise present challenges, the pronounced advantages of reduced prototyping expenses, superior product quality, and accelerated time-to-market are fueling sustained market growth. Future developments indicate a trend towards integrating 3D electromagnetic simulation with other simulation modalities, enabling multiphysics simulations and a more comprehensive design methodology. The emergence of cloud-based solutions is also expected to broaden accessibility and affordability of this technology.
3D Electromagnetic Simulation Software Company Market Share
3D Electromagnetic Simulation Software Market Report: 2019-2033
This comprehensive report provides an in-depth analysis of the 3D Electromagnetic Simulation Software market, encompassing market dynamics, growth trends, regional dominance, product landscape, key players, and future outlook. The study period covers 2019-2033, with 2025 as the base and estimated year. The forecast period spans 2025-2033, and the historical period encompasses 2019-2024. This report is crucial for industry professionals, investors, and researchers seeking a clear understanding of this rapidly evolving market. The market is valued at $XX million in 2025 and is projected to reach $XX million by 2033.
3D Electromagnetic Simulation Software Market Dynamics & Structure
The 3D Electromagnetic Simulation Software market is characterized by a moderately concentrated structure, with key players like Ansys, Dassault Systèmes, and Remcom holding significant market share. The market's growth is fueled by technological innovations, particularly in high-frequency electronics, 5G, and autonomous vehicles. Regulatory frameworks, particularly those concerning electromagnetic compatibility (EMC) and safety standards, heavily influence market demand. Competitive substitutes include physical prototyping and simpler simulation methods, but the accuracy and cost-effectiveness of 3D electromagnetic simulation often outweigh these alternatives. The end-user demographics span various industries including aerospace, automotive, telecommunications, and defense. The market has witnessed several mergers and acquisitions (M&A) in recent years, driving consolidation and technological integration.
- Market Concentration: Moderately concentrated, with top 5 players holding approximately XX% market share in 2025.
- Technological Innovation Drivers: Advancements in computational power, algorithm development, and high-frequency applications.
- Regulatory Frameworks: Stringent EMC and safety standards drive demand for accurate simulation.
- Competitive Substitutes: Physical prototyping and simpler simulation methods, but with limitations in accuracy and cost.
- End-User Demographics: Diverse, spanning aerospace, automotive, telecommunications, defense, and consumer electronics.
- M&A Trends: XX major M&A deals recorded between 2019 and 2024, with a predicted XX deals for 2025-2033. Consolidation is a key trend.
- Innovation Barriers: High development costs, specialized expertise required, and validation complexities.
3D Electromagnetic Simulation Software Growth Trends & Insights
The 3D electromagnetic simulation software market exhibits robust growth, driven by increasing demand for accurate and efficient design processes across various industries. The market experienced a CAGR of XX% during the historical period (2019-2024) and is projected to maintain a CAGR of XX% during the forecast period (2025-2033). This growth is attributed to the rising adoption of advanced technologies such as 5G, IoT, and autonomous vehicles, all of which require sophisticated electromagnetic simulations for optimal performance and regulatory compliance. Technological disruptions, such as the development of more efficient solvers and cloud-based solutions, are accelerating market penetration. Consumer behavior shifts towards faster product development cycles and reduced prototyping costs further bolster market growth. Market penetration is expected to reach XX% by 2033.
Dominant Regions, Countries, or Segments in 3D Electromagnetic Simulation Software
North America currently holds the largest market share, driven by a strong presence of major players, significant R&D investments, and the presence of key industries. Europe and Asia-Pacific follow closely, with strong growth expected in Asia-Pacific due to rapid technological advancements and increasing investments in infrastructure development, particularly in 5G and telecommunications. The defense and aerospace segments exhibit particularly high growth potential owing to the stringent requirements for electromagnetic compatibility and performance.
- Key Drivers in North America: Strong presence of major players, substantial R&D spending, robust aerospace and defense sectors.
- Key Drivers in Europe: Growing adoption in automotive and telecommunications, stringent regulatory environment.
- Key Drivers in Asia-Pacific: Rapid technological advancements, increasing investments in 5G infrastructure, strong growth in electronics manufacturing.
- Dominant Segment: Aerospace and Defense, driven by stringent regulatory requirements and high performance standards.
- Market Share (2025): North America (XX%), Europe (XX%), Asia-Pacific (XX%), Rest of World (XX%).
3D Electromagnetic Simulation Software Product Landscape
The market offers a diverse range of software solutions, catering to various application needs and user expertise levels. Products range from basic antenna design tools to highly sophisticated full-wave solvers capable of analyzing complex electromagnetic phenomena. Key differentiators include simulation speed, accuracy, ease of use, and integration with other design tools. Recent advancements include the integration of AI and machine learning for faster and more efficient simulations, as well as cloud-based solutions for improved accessibility and scalability. The development of high-performance computing (HPC) capabilities enables the simulation of increasingly complex electromagnetic systems.
Key Drivers, Barriers & Challenges in 3D Electromagnetic Simulation Software
Key Drivers:
- Growing demand for high-frequency electronics (5G, mmWave).
- Increasing adoption of IoT and autonomous vehicles.
- Stringent regulatory requirements for EMC and safety compliance.
- Need for faster and more efficient product development cycles.
Challenges:
- High software costs and licensing fees can be a barrier for smaller companies. This represents approximately XX% of the market's operational expenditure.
- The requirement for specialized expertise to effectively utilize the software limits wider adoption.
- Maintaining accuracy while managing computational cost remains a continuous challenge.
Emerging Opportunities in 3D Electromagnetic Simulation Software
- Expansion into emerging markets: Untapped potential exists in developing economies with growing electronics manufacturing industries.
- Integration with AI and machine learning: This can lead to faster and more efficient simulations with improved accuracy.
- Development of cloud-based solutions: This increases accessibility and scalability, reducing computational costs.
- Focus on specific niche applications: Developing specialized software for electric vehicles, medical devices, and other niche applications can open new opportunities.
Growth Accelerators in the 3D Electromagnetic Simulation Software Industry
Long-term growth is driven by continued technological advancements, strategic partnerships to expand into new markets, and the development of innovative applications that expand market reach. Strategic acquisitions of smaller companies with specialized technologies will also fuel growth. Expansion into new industries, such as renewable energy and biomedical engineering, represent significant growth opportunities.
Key Players Shaping the 3D Electromagnetic Simulation Software Market
- Remcom
- Ansys
- Dassault Systèmes
- AWR
- Agilent
- Mentor Graphics
- Altair
- CST Studio Suite
- EMWorks
- Elmer FEM
- Cadence Design Systems
- JCMwave
- Tera Analysis
- Hollywave
- ANSCOS
- Microunie
- Dhorde
Notable Milestones in 3D Electromagnetic Simulation Software Sector
- 2020: Ansys acquired Helic, expanding its capabilities in high-frequency simulation.
- 2021: Dassault Systèmes released a new version of its electromagnetic simulation software with enhanced capabilities.
- 2022: Remcom launched a cloud-based electromagnetic simulation platform.
- 2023: Several key players released updates incorporating AI and machine learning capabilities.
- 2024: Increased focus on multiphysics simulation, incorporating electromagnetic simulation with other domains (e.g., thermal, structural).
In-Depth 3D Electromagnetic Simulation Software Market Outlook
The 3D electromagnetic simulation software market is poised for continued robust growth, driven by technological innovation and expanding application across diverse industries. Future market potential is substantial, particularly in emerging markets and niche applications. Strategic partnerships, acquisitions, and the development of user-friendly, cloud-based solutions will be crucial for market leadership. The integration of AI and machine learning will further enhance simulation accuracy and efficiency, unlocking new possibilities for complex electromagnetic system design.
3D Electromagnetic Simulation Software Segmentation
-
1. Application
- 1.1. Antenna Design
- 1.2. Automotive Radar
- 1.3. Biomedical
- 1.4. Metamaterial
- 1.5. Microwave Equipment
- 1.6. Mobile Device
- 1.7. Others
-
2. Types
- 2.1. Finite Element Method
- 2.2. Finite Integral Method
- 2.3. Method of Moments
3D Electromagnetic Simulation Software Segmentation By Geography
-
1. North America
- 1.1. United States
- 1.2. Canada
- 1.3. Mexico
-
2. South America
- 2.1. Brazil
- 2.2. Argentina
- 2.3. Rest of South America
-
3. Europe
- 3.1. United Kingdom
- 3.2. Germany
- 3.3. France
- 3.4. Italy
- 3.5. Spain
- 3.6. Russia
- 3.7. Benelux
- 3.8. Nordics
- 3.9. Rest of Europe
-
4. Middle East & Africa
- 4.1. Turkey
- 4.2. Israel
- 4.3. GCC
- 4.4. North Africa
- 4.5. South Africa
- 4.6. Rest of Middle East & Africa
-
5. Asia Pacific
- 5.1. China
- 5.2. India
- 5.3. Japan
- 5.4. South Korea
- 5.5. ASEAN
- 5.6. Oceania
- 5.7. Rest of Asia Pacific

3D Electromagnetic Simulation Software Regional Market Share
Geographic Coverage of 3D Electromagnetic Simulation Software
3D Electromagnetic Simulation Software REPORT HIGHLIGHTS
| Aspects | Details |
|---|---|
| Study Period | 2020-2034 |
| Base Year | 2025 |
| Estimated Year | 2026 |
| Forecast Period | 2026-2034 |
| Historical Period | 2020-2025 |
| Growth Rate | CAGR of 16.5% from 2020-2034 |
| Segmentation |
|
Table of Contents
- 1. Introduction
- 1.1. Research Scope
- 1.2. Market Segmentation
- 1.3. Research Methodology
- 1.4. Definitions and Assumptions
- 2. Executive Summary
- 2.1. Introduction
- 3. Market Dynamics
- 3.1. Introduction
- 3.2. Market Drivers
- 3.3. Market Restrains
- 3.4. Market Trends
- 4. Market Factor Analysis
- 4.1. Porters Five Forces
- 4.2. Supply/Value Chain
- 4.3. PESTEL analysis
- 4.4. Market Entropy
- 4.5. Patent/Trademark Analysis
- 5. Global 3D Electromagnetic Simulation Software Analysis, Insights and Forecast, 2020-2032
- 5.1. Market Analysis, Insights and Forecast - by Application
- 5.1.1. Antenna Design
- 5.1.2. Automotive Radar
- 5.1.3. Biomedical
- 5.1.4. Metamaterial
- 5.1.5. Microwave Equipment
- 5.1.6. Mobile Device
- 5.1.7. Others
- 5.2. Market Analysis, Insights and Forecast - by Types
- 5.2.1. Finite Element Method
- 5.2.2. Finite Integral Method
- 5.2.3. Method of Moments
- 5.3. Market Analysis, Insights and Forecast - by Region
- 5.3.1. North America
- 5.3.2. South America
- 5.3.3. Europe
- 5.3.4. Middle East & Africa
- 5.3.5. Asia Pacific
- 5.1. Market Analysis, Insights and Forecast - by Application
- 6. North America 3D Electromagnetic Simulation Software Analysis, Insights and Forecast, 2020-2032
- 6.1. Market Analysis, Insights and Forecast - by Application
- 6.1.1. Antenna Design
- 6.1.2. Automotive Radar
- 6.1.3. Biomedical
- 6.1.4. Metamaterial
- 6.1.5. Microwave Equipment
- 6.1.6. Mobile Device
- 6.1.7. Others
- 6.2. Market Analysis, Insights and Forecast - by Types
- 6.2.1. Finite Element Method
- 6.2.2. Finite Integral Method
- 6.2.3. Method of Moments
- 6.1. Market Analysis, Insights and Forecast - by Application
- 7. South America 3D Electromagnetic Simulation Software Analysis, Insights and Forecast, 2020-2032
- 7.1. Market Analysis, Insights and Forecast - by Application
- 7.1.1. Antenna Design
- 7.1.2. Automotive Radar
- 7.1.3. Biomedical
- 7.1.4. Metamaterial
- 7.1.5. Microwave Equipment
- 7.1.6. Mobile Device
- 7.1.7. Others
- 7.2. Market Analysis, Insights and Forecast - by Types
- 7.2.1. Finite Element Method
- 7.2.2. Finite Integral Method
- 7.2.3. Method of Moments
- 7.1. Market Analysis, Insights and Forecast - by Application
- 8. Europe 3D Electromagnetic Simulation Software Analysis, Insights and Forecast, 2020-2032
- 8.1. Market Analysis, Insights and Forecast - by Application
- 8.1.1. Antenna Design
- 8.1.2. Automotive Radar
- 8.1.3. Biomedical
- 8.1.4. Metamaterial
- 8.1.5. Microwave Equipment
- 8.1.6. Mobile Device
- 8.1.7. Others
- 8.2. Market Analysis, Insights and Forecast - by Types
- 8.2.1. Finite Element Method
- 8.2.2. Finite Integral Method
- 8.2.3. Method of Moments
- 8.1. Market Analysis, Insights and Forecast - by Application
- 9. Middle East & Africa 3D Electromagnetic Simulation Software Analysis, Insights and Forecast, 2020-2032
- 9.1. Market Analysis, Insights and Forecast - by Application
- 9.1.1. Antenna Design
- 9.1.2. Automotive Radar
- 9.1.3. Biomedical
- 9.1.4. Metamaterial
- 9.1.5. Microwave Equipment
- 9.1.6. Mobile Device
- 9.1.7. Others
- 9.2. Market Analysis, Insights and Forecast - by Types
- 9.2.1. Finite Element Method
- 9.2.2. Finite Integral Method
- 9.2.3. Method of Moments
- 9.1. Market Analysis, Insights and Forecast - by Application
- 10. Asia Pacific 3D Electromagnetic Simulation Software Analysis, Insights and Forecast, 2020-2032
- 10.1. Market Analysis, Insights and Forecast - by Application
- 10.1.1. Antenna Design
- 10.1.2. Automotive Radar
- 10.1.3. Biomedical
- 10.1.4. Metamaterial
- 10.1.5. Microwave Equipment
- 10.1.6. Mobile Device
- 10.1.7. Others
- 10.2. Market Analysis, Insights and Forecast - by Types
- 10.2.1. Finite Element Method
- 10.2.2. Finite Integral Method
- 10.2.3. Method of Moments
- 10.1. Market Analysis, Insights and Forecast - by Application
- 11. Competitive Analysis
- 11.1. Global Market Share Analysis 2025
- 11.2. Company Profiles
- 11.2.1 Remcom
- 11.2.1.1. Overview
- 11.2.1.2. Products
- 11.2.1.3. SWOT Analysis
- 11.2.1.4. Recent Developments
- 11.2.1.5. Financials (Based on Availability)
- 11.2.2 Ansys
- 11.2.2.1. Overview
- 11.2.2.2. Products
- 11.2.2.3. SWOT Analysis
- 11.2.2.4. Recent Developments
- 11.2.2.5. Financials (Based on Availability)
- 11.2.3 Dassault Systèmes
- 11.2.3.1. Overview
- 11.2.3.2. Products
- 11.2.3.3. SWOT Analysis
- 11.2.3.4. Recent Developments
- 11.2.3.5. Financials (Based on Availability)
- 11.2.4 AWR
- 11.2.4.1. Overview
- 11.2.4.2. Products
- 11.2.4.3. SWOT Analysis
- 11.2.4.4. Recent Developments
- 11.2.4.5. Financials (Based on Availability)
- 11.2.5 Agilent
- 11.2.5.1. Overview
- 11.2.5.2. Products
- 11.2.5.3. SWOT Analysis
- 11.2.5.4. Recent Developments
- 11.2.5.5. Financials (Based on Availability)
- 11.2.6 Mentor Graphics
- 11.2.6.1. Overview
- 11.2.6.2. Products
- 11.2.6.3. SWOT Analysis
- 11.2.6.4. Recent Developments
- 11.2.6.5. Financials (Based on Availability)
- 11.2.7 Altair
- 11.2.7.1. Overview
- 11.2.7.2. Products
- 11.2.7.3. SWOT Analysis
- 11.2.7.4. Recent Developments
- 11.2.7.5. Financials (Based on Availability)
- 11.2.8 CST Studio Suite
- 11.2.8.1. Overview
- 11.2.8.2. Products
- 11.2.8.3. SWOT Analysis
- 11.2.8.4. Recent Developments
- 11.2.8.5. Financials (Based on Availability)
- 11.2.9 EMWorks
- 11.2.9.1. Overview
- 11.2.9.2. Products
- 11.2.9.3. SWOT Analysis
- 11.2.9.4. Recent Developments
- 11.2.9.5. Financials (Based on Availability)
- 11.2.10 Elmer FEM
- 11.2.10.1. Overview
- 11.2.10.2. Products
- 11.2.10.3. SWOT Analysis
- 11.2.10.4. Recent Developments
- 11.2.10.5. Financials (Based on Availability)
- 11.2.11 Cadence Design Systems
- 11.2.11.1. Overview
- 11.2.11.2. Products
- 11.2.11.3. SWOT Analysis
- 11.2.11.4. Recent Developments
- 11.2.11.5. Financials (Based on Availability)
- 11.2.12 JCMwave
- 11.2.12.1. Overview
- 11.2.12.2. Products
- 11.2.12.3. SWOT Analysis
- 11.2.12.4. Recent Developments
- 11.2.12.5. Financials (Based on Availability)
- 11.2.13 Tera Analysis
- 11.2.13.1. Overview
- 11.2.13.2. Products
- 11.2.13.3. SWOT Analysis
- 11.2.13.4. Recent Developments
- 11.2.13.5. Financials (Based on Availability)
- 11.2.14 Hollywave
- 11.2.14.1. Overview
- 11.2.14.2. Products
- 11.2.14.3. SWOT Analysis
- 11.2.14.4. Recent Developments
- 11.2.14.5. Financials (Based on Availability)
- 11.2.15 ANSCOS
- 11.2.15.1. Overview
- 11.2.15.2. Products
- 11.2.15.3. SWOT Analysis
- 11.2.15.4. Recent Developments
- 11.2.15.5. Financials (Based on Availability)
- 11.2.16 Microunie
- 11.2.16.1. Overview
- 11.2.16.2. Products
- 11.2.16.3. SWOT Analysis
- 11.2.16.4. Recent Developments
- 11.2.16.5. Financials (Based on Availability)
- 11.2.17 Dhorde
- 11.2.17.1. Overview
- 11.2.17.2. Products
- 11.2.17.3. SWOT Analysis
- 11.2.17.4. Recent Developments
- 11.2.17.5. Financials (Based on Availability)
- 11.2.1 Remcom
List of Figures
- Figure 1: Global 3D Electromagnetic Simulation Software Revenue Breakdown (billion, %) by Region 2025 & 2033
- Figure 2: North America 3D Electromagnetic Simulation Software Revenue (billion), by Application 2025 & 2033
- Figure 3: North America 3D Electromagnetic Simulation Software Revenue Share (%), by Application 2025 & 2033
- Figure 4: North America 3D Electromagnetic Simulation Software Revenue (billion), by Types 2025 & 2033
- Figure 5: North America 3D Electromagnetic Simulation Software Revenue Share (%), by Types 2025 & 2033
- Figure 6: North America 3D Electromagnetic Simulation Software Revenue (billion), by Country 2025 & 2033
- Figure 7: North America 3D Electromagnetic Simulation Software Revenue Share (%), by Country 2025 & 2033
- Figure 8: South America 3D Electromagnetic Simulation Software Revenue (billion), by Application 2025 & 2033
- Figure 9: South America 3D Electromagnetic Simulation Software Revenue Share (%), by Application 2025 & 2033
- Figure 10: South America 3D Electromagnetic Simulation Software Revenue (billion), by Types 2025 & 2033
- Figure 11: South America 3D Electromagnetic Simulation Software Revenue Share (%), by Types 2025 & 2033
- Figure 12: South America 3D Electromagnetic Simulation Software Revenue (billion), by Country 2025 & 2033
- Figure 13: South America 3D Electromagnetic Simulation Software Revenue Share (%), by Country 2025 & 2033
- Figure 14: Europe 3D Electromagnetic Simulation Software Revenue (billion), by Application 2025 & 2033
- Figure 15: Europe 3D Electromagnetic Simulation Software Revenue Share (%), by Application 2025 & 2033
- Figure 16: Europe 3D Electromagnetic Simulation Software Revenue (billion), by Types 2025 & 2033
- Figure 17: Europe 3D Electromagnetic Simulation Software Revenue Share (%), by Types 2025 & 2033
- Figure 18: Europe 3D Electromagnetic Simulation Software Revenue (billion), by Country 2025 & 2033
- Figure 19: Europe 3D Electromagnetic Simulation Software Revenue Share (%), by Country 2025 & 2033
- Figure 20: Middle East & Africa 3D Electromagnetic Simulation Software Revenue (billion), by Application 2025 & 2033
- Figure 21: Middle East & Africa 3D Electromagnetic Simulation Software Revenue Share (%), by Application 2025 & 2033
- Figure 22: Middle East & Africa 3D Electromagnetic Simulation Software Revenue (billion), by Types 2025 & 2033
- Figure 23: Middle East & Africa 3D Electromagnetic Simulation Software Revenue Share (%), by Types 2025 & 2033
- Figure 24: Middle East & Africa 3D Electromagnetic Simulation Software Revenue (billion), by Country 2025 & 2033
- Figure 25: Middle East & Africa 3D Electromagnetic Simulation Software Revenue Share (%), by Country 2025 & 2033
- Figure 26: Asia Pacific 3D Electromagnetic Simulation Software Revenue (billion), by Application 2025 & 2033
- Figure 27: Asia Pacific 3D Electromagnetic Simulation Software Revenue Share (%), by Application 2025 & 2033
- Figure 28: Asia Pacific 3D Electromagnetic Simulation Software Revenue (billion), by Types 2025 & 2033
- Figure 29: Asia Pacific 3D Electromagnetic Simulation Software Revenue Share (%), by Types 2025 & 2033
- Figure 30: Asia Pacific 3D Electromagnetic Simulation Software Revenue (billion), by Country 2025 & 2033
- Figure 31: Asia Pacific 3D Electromagnetic Simulation Software Revenue Share (%), by Country 2025 & 2033
List of Tables
- Table 1: Global 3D Electromagnetic Simulation Software Revenue billion Forecast, by Application 2020 & 2033
- Table 2: Global 3D Electromagnetic Simulation Software Revenue billion Forecast, by Types 2020 & 2033
- Table 3: Global 3D Electromagnetic Simulation Software Revenue billion Forecast, by Region 2020 & 2033
- Table 4: Global 3D Electromagnetic Simulation Software Revenue billion Forecast, by Application 2020 & 2033
- Table 5: Global 3D Electromagnetic Simulation Software Revenue billion Forecast, by Types 2020 & 2033
- Table 6: Global 3D Electromagnetic Simulation Software Revenue billion Forecast, by Country 2020 & 2033
- Table 7: United States 3D Electromagnetic Simulation Software Revenue (billion) Forecast, by Application 2020 & 2033
- Table 8: Canada 3D Electromagnetic Simulation Software Revenue (billion) Forecast, by Application 2020 & 2033
- Table 9: Mexico 3D Electromagnetic Simulation Software Revenue (billion) Forecast, by Application 2020 & 2033
- Table 10: Global 3D Electromagnetic Simulation Software Revenue billion Forecast, by Application 2020 & 2033
- Table 11: Global 3D Electromagnetic Simulation Software Revenue billion Forecast, by Types 2020 & 2033
- Table 12: Global 3D Electromagnetic Simulation Software Revenue billion Forecast, by Country 2020 & 2033
- Table 13: Brazil 3D Electromagnetic Simulation Software Revenue (billion) Forecast, by Application 2020 & 2033
- Table 14: Argentina 3D Electromagnetic Simulation Software Revenue (billion) Forecast, by Application 2020 & 2033
- Table 15: Rest of South America 3D Electromagnetic Simulation Software Revenue (billion) Forecast, by Application 2020 & 2033
- Table 16: Global 3D Electromagnetic Simulation Software Revenue billion Forecast, by Application 2020 & 2033
- Table 17: Global 3D Electromagnetic Simulation Software Revenue billion Forecast, by Types 2020 & 2033
- Table 18: Global 3D Electromagnetic Simulation Software Revenue billion Forecast, by Country 2020 & 2033
- Table 19: United Kingdom 3D Electromagnetic Simulation Software Revenue (billion) Forecast, by Application 2020 & 2033
- Table 20: Germany 3D Electromagnetic Simulation Software Revenue (billion) Forecast, by Application 2020 & 2033
- Table 21: France 3D Electromagnetic Simulation Software Revenue (billion) Forecast, by Application 2020 & 2033
- Table 22: Italy 3D Electromagnetic Simulation Software Revenue (billion) Forecast, by Application 2020 & 2033
- Table 23: Spain 3D Electromagnetic Simulation Software Revenue (billion) Forecast, by Application 2020 & 2033
- Table 24: Russia 3D Electromagnetic Simulation Software Revenue (billion) Forecast, by Application 2020 & 2033
- Table 25: Benelux 3D Electromagnetic Simulation Software Revenue (billion) Forecast, by Application 2020 & 2033
- Table 26: Nordics 3D Electromagnetic Simulation Software Revenue (billion) Forecast, by Application 2020 & 2033
- Table 27: Rest of Europe 3D Electromagnetic Simulation Software Revenue (billion) Forecast, by Application 2020 & 2033
- Table 28: Global 3D Electromagnetic Simulation Software Revenue billion Forecast, by Application 2020 & 2033
- Table 29: Global 3D Electromagnetic Simulation Software Revenue billion Forecast, by Types 2020 & 2033
- Table 30: Global 3D Electromagnetic Simulation Software Revenue billion Forecast, by Country 2020 & 2033
- Table 31: Turkey 3D Electromagnetic Simulation Software Revenue (billion) Forecast, by Application 2020 & 2033
- Table 32: Israel 3D Electromagnetic Simulation Software Revenue (billion) Forecast, by Application 2020 & 2033
- Table 33: GCC 3D Electromagnetic Simulation Software Revenue (billion) Forecast, by Application 2020 & 2033
- Table 34: North Africa 3D Electromagnetic Simulation Software Revenue (billion) Forecast, by Application 2020 & 2033
- Table 35: South Africa 3D Electromagnetic Simulation Software Revenue (billion) Forecast, by Application 2020 & 2033
- Table 36: Rest of Middle East & Africa 3D Electromagnetic Simulation Software Revenue (billion) Forecast, by Application 2020 & 2033
- Table 37: Global 3D Electromagnetic Simulation Software Revenue billion Forecast, by Application 2020 & 2033
- Table 38: Global 3D Electromagnetic Simulation Software Revenue billion Forecast, by Types 2020 & 2033
- Table 39: Global 3D Electromagnetic Simulation Software Revenue billion Forecast, by Country 2020 & 2033
- Table 40: China 3D Electromagnetic Simulation Software Revenue (billion) Forecast, by Application 2020 & 2033
- Table 41: India 3D Electromagnetic Simulation Software Revenue (billion) Forecast, by Application 2020 & 2033
- Table 42: Japan 3D Electromagnetic Simulation Software Revenue (billion) Forecast, by Application 2020 & 2033
- Table 43: South Korea 3D Electromagnetic Simulation Software Revenue (billion) Forecast, by Application 2020 & 2033
- Table 44: ASEAN 3D Electromagnetic Simulation Software Revenue (billion) Forecast, by Application 2020 & 2033
- Table 45: Oceania 3D Electromagnetic Simulation Software Revenue (billion) Forecast, by Application 2020 & 2033
- Table 46: Rest of Asia Pacific 3D Electromagnetic Simulation Software Revenue (billion) Forecast, by Application 2020 & 2033
Frequently Asked Questions
1. What is the projected Compound Annual Growth Rate (CAGR) of the 3D Electromagnetic Simulation Software?
The projected CAGR is approximately 16.5%.
2. Which companies are prominent players in the 3D Electromagnetic Simulation Software?
Key companies in the market include Remcom, Ansys, Dassault Systèmes, AWR, Agilent, Mentor Graphics, Altair, CST Studio Suite, EMWorks, Elmer FEM, Cadence Design Systems, JCMwave, Tera Analysis, Hollywave, ANSCOS, Microunie, Dhorde.
3. What are the main segments of the 3D Electromagnetic Simulation Software?
The market segments include Application, Types.
4. Can you provide details about the market size?
The market size is estimated to be USD 19.2 billion as of 2022.
5. What are some drivers contributing to market growth?
N/A
6. What are the notable trends driving market growth?
N/A
7. Are there any restraints impacting market growth?
N/A
8. Can you provide examples of recent developments in the market?
N/A
9. What pricing options are available for accessing the report?
Pricing options include single-user, multi-user, and enterprise licenses priced at USD 3950.00, USD 5925.00, and USD 7900.00 respectively.
10. Is the market size provided in terms of value or volume?
The market size is provided in terms of value, measured in billion.
11. Are there any specific market keywords associated with the report?
Yes, the market keyword associated with the report is "3D Electromagnetic Simulation Software," which aids in identifying and referencing the specific market segment covered.
12. How do I determine which pricing option suits my needs best?
The pricing options vary based on user requirements and access needs. Individual users may opt for single-user licenses, while businesses requiring broader access may choose multi-user or enterprise licenses for cost-effective access to the report.
13. Are there any additional resources or data provided in the 3D Electromagnetic Simulation Software report?
While the report offers comprehensive insights, it's advisable to review the specific contents or supplementary materials provided to ascertain if additional resources or data are available.
14. How can I stay updated on further developments or reports in the 3D Electromagnetic Simulation Software?
To stay informed about further developments, trends, and reports in the 3D Electromagnetic Simulation Software, consider subscribing to industry newsletters, following relevant companies and organizations, or regularly checking reputable industry news sources and publications.
Methodology
Step 1 - Identification of Relevant Samples Size from Population Database


Step 2 - Approaches for Defining Global Market Size (Value, Volume* & Price*)

Note*: In applicable scenarios
Step 3 - Data Sources
Primary Research
- Web Analytics
- Survey Reports
- Research Institute
- Latest Research Reports
- Opinion Leaders
Secondary Research
- Annual Reports
- White Paper
- Latest Press Release
- Industry Association
- Paid Database
- Investor Presentations

Step 4 - Data Triangulation
Involves using different sources of information in order to increase the validity of a study
These sources are likely to be stakeholders in a program - participants, other researchers, program staff, other community members, and so on.
Then we put all data in single framework & apply various statistical tools to find out the dynamic on the market.
During the analysis stage, feedback from the stakeholder groups would be compared to determine areas of agreement as well as areas of divergence

